


Our Homes Sell 15% More Nights Than the Market
How FunStay Florida’s Orlando vacation rental management stacks up against the competition, measured home by home. Not promises. PriceLabs data.
of our homes beat their competitive set on occupancy
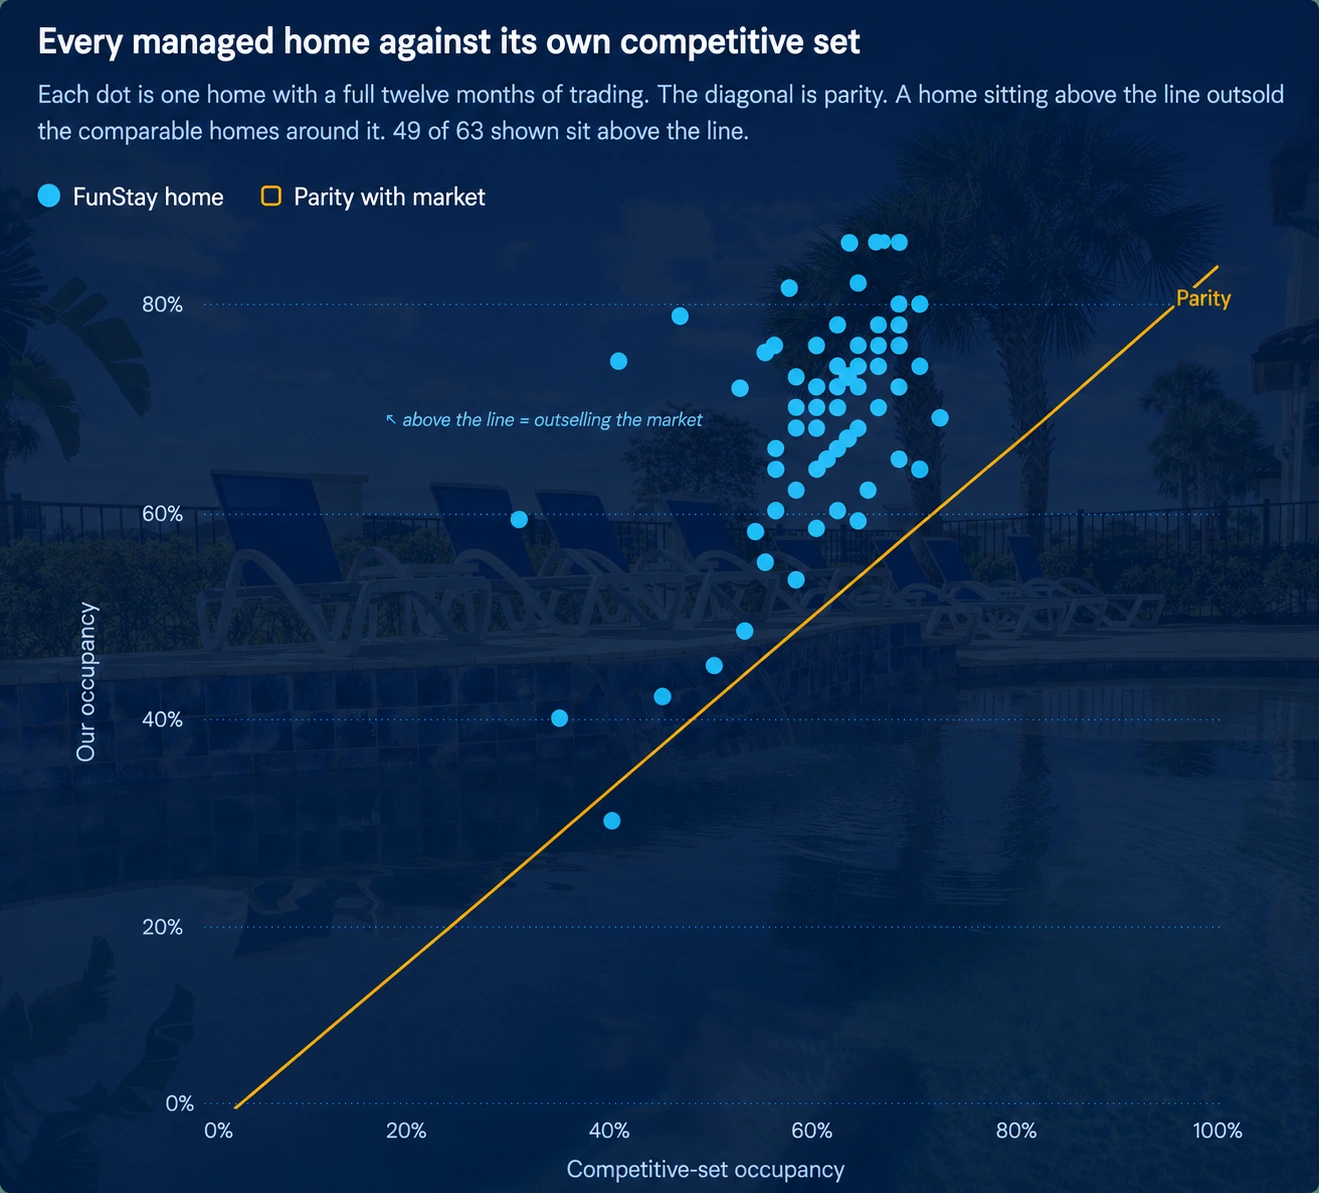
49 of 63 homes
Occupancy advantage vs. competitive set
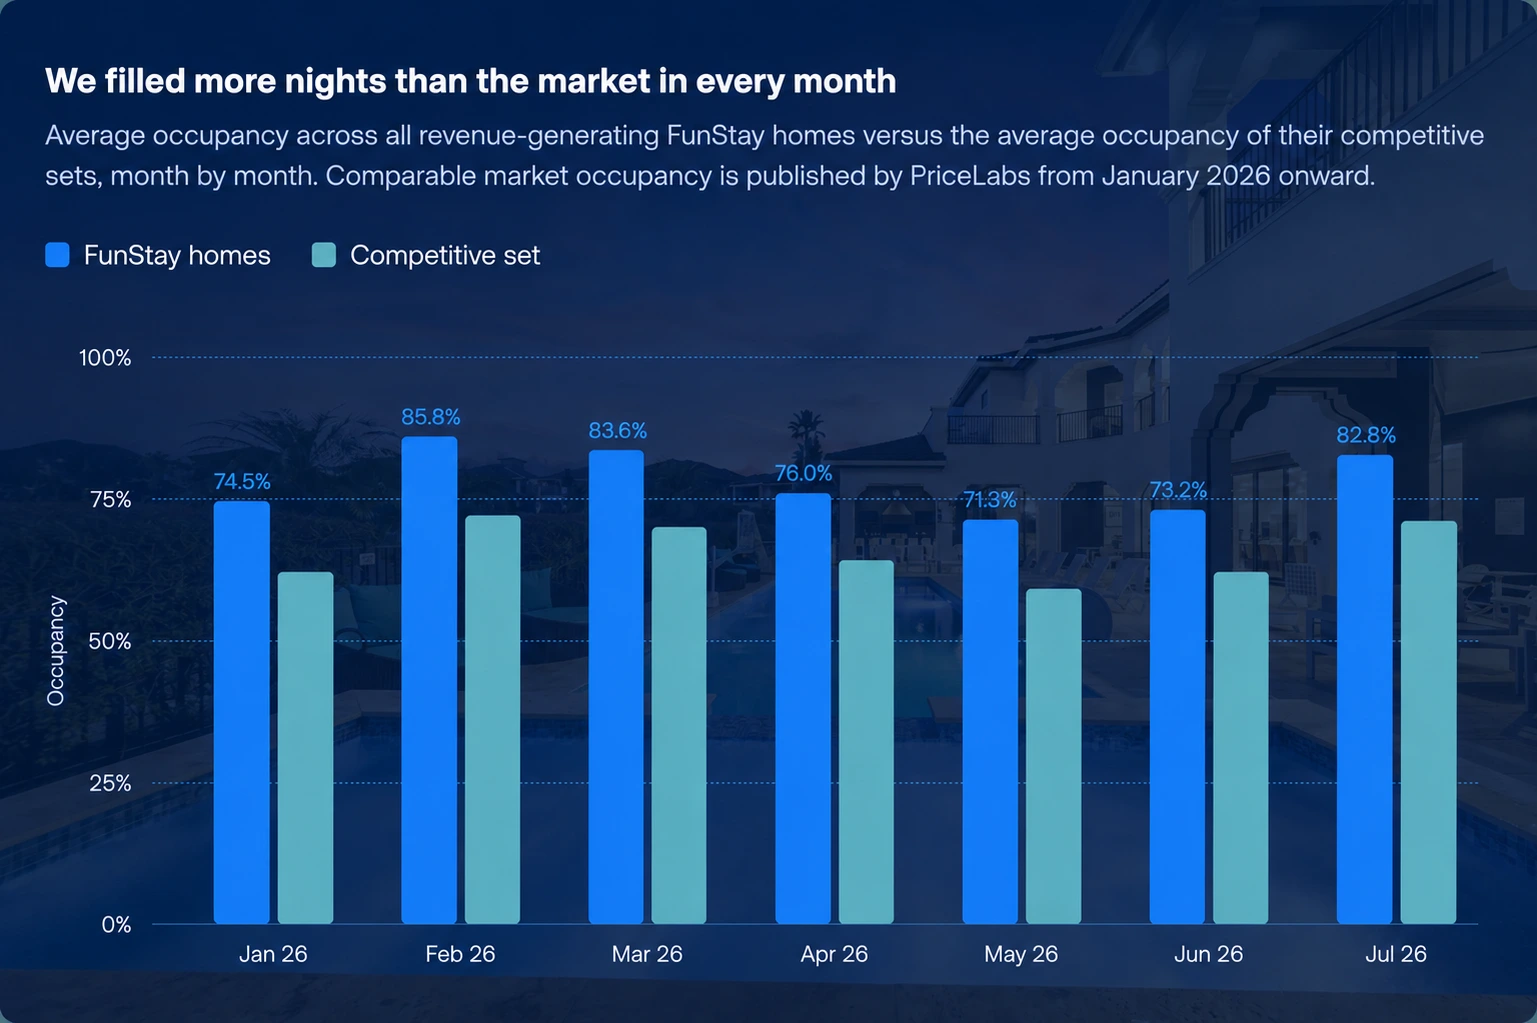
68.0% ours vs. 61.1% market
Average length of stay (nights)
Comp-set benchmark: 4.0 nights
RevPAR on the books for 2026 vs. same point last year
↑ $84.21 vs. $67.40
Every Orlando vacation rental management company says they’ll “maximize your revenue.” Few show you the numbers. We’re showing you ours.
Over the twelve months ending July 2026, we measured every FunStay home against its own local competitive set. Not a city-wide average. Each home compared to nearby listings with the same bedroom count, pulled straight from PriceLabs. A 3-bedroom Windsor Hills condo in our portfolio? Measured against 343 nearby 3-bedroom listings.
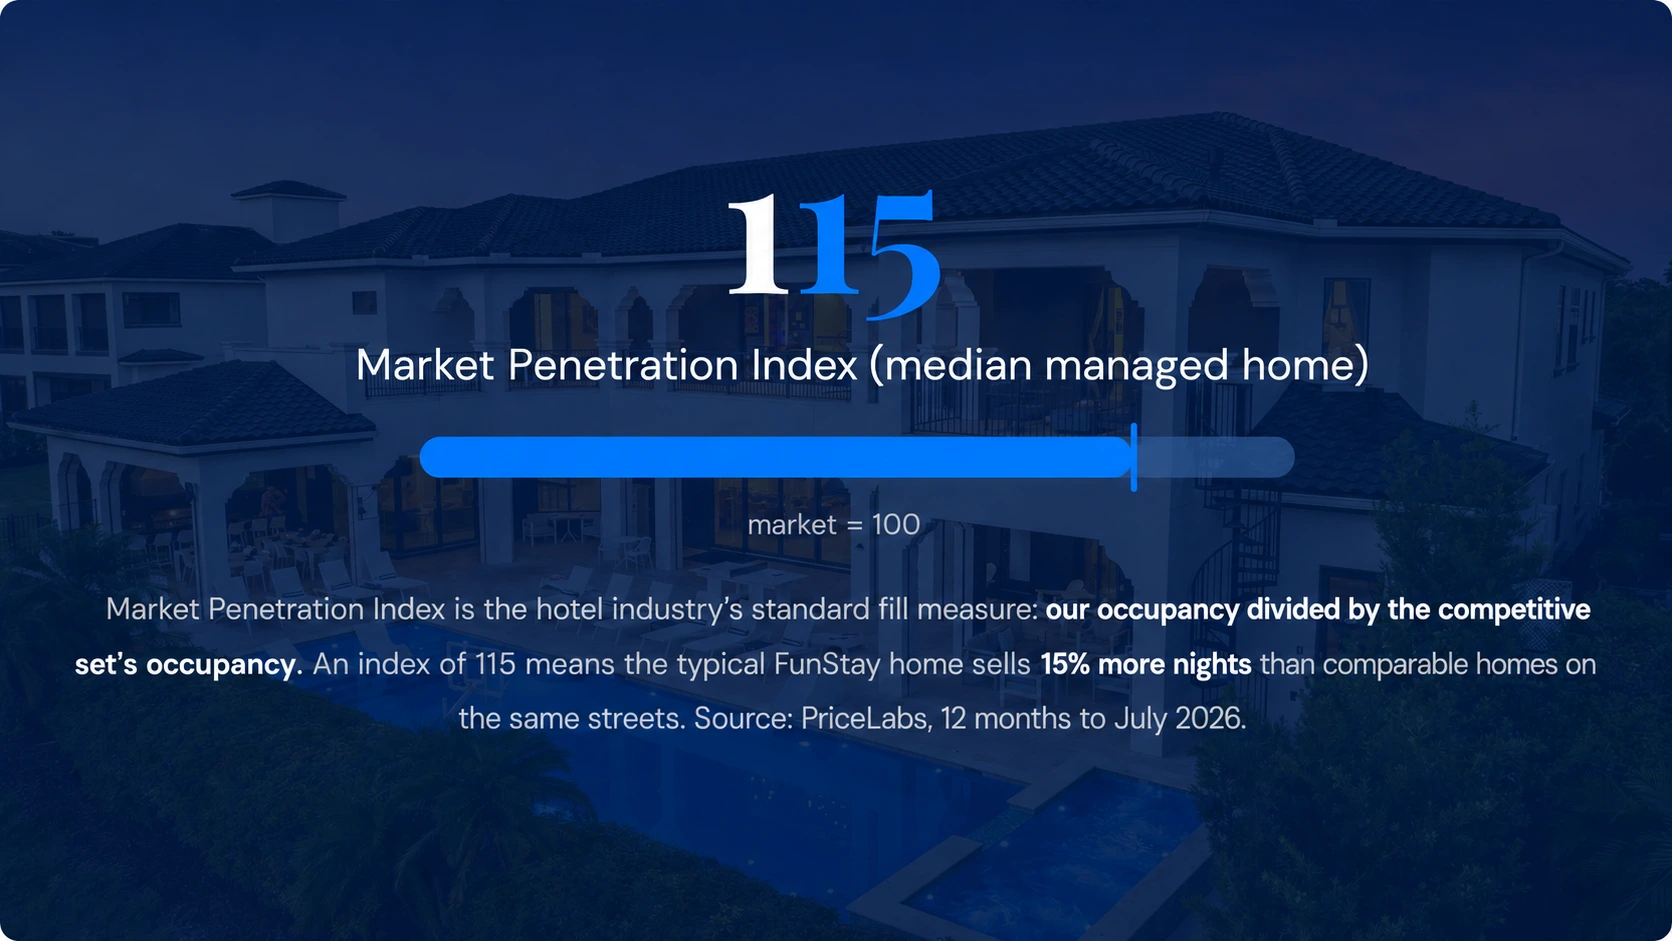
49 of 63 homes with a full twelve-month track record outperformed their competitive set. The typical FunStay home sells 15% more nights than comparable homes on the same streets.
That’s what the right Orlando vacation rental management strategy does. Not marginal improvement. Consistent, measurable outperformance at every home size, in every month, across every market we serve. If you’re comparing vacation rental management Orlando companies, this is the benchmark.
Why This Data Matters for Orlando Vacation Rental Owners
The Orlando short-term rental market has over 15,000 active listings. If you’re looking for the best Airbnb management company Orlando has to offer, the only question that matters is: does your manager actually fill more nights than the competition? The average self-managed property in Kissimmee and Davenport runs somewhere between 43% and 55% occupancy. That’s a lot of empty nights.
A property sitting empty on a Tuesday in October isn’t just missing one night of revenue. It’s missing the compound effect: fewer bookings means fewer reviews, which means lower search rankings, which means even fewer bookings next month. I’ve watched that cycle bury properties that should be doing well.
Our portfolio runs at 68.0% occupancy against a 61.1% competitive set average. That 6.9-point gap compounds across 365 nights. On a property earning $200 per night, that’s roughly 25 extra booked nights per year. An extra $5,000 in Orlando vacation rental revenue from occupancy alone, before we even talk about rate optimization. That’s the difference between good short-term rental management Orlando owners settle for and the kind that actually moves the needle.
The Advantage Holds at Every Home Size
This isn’t just a few star performers pulling up the average. From two-bedroom condos to ten-bedroom villas, the managed portfolio sits above its market. It’s one of the reasons owners searching for Orlando vacation rental management that actually delivers keep coming back to the data.
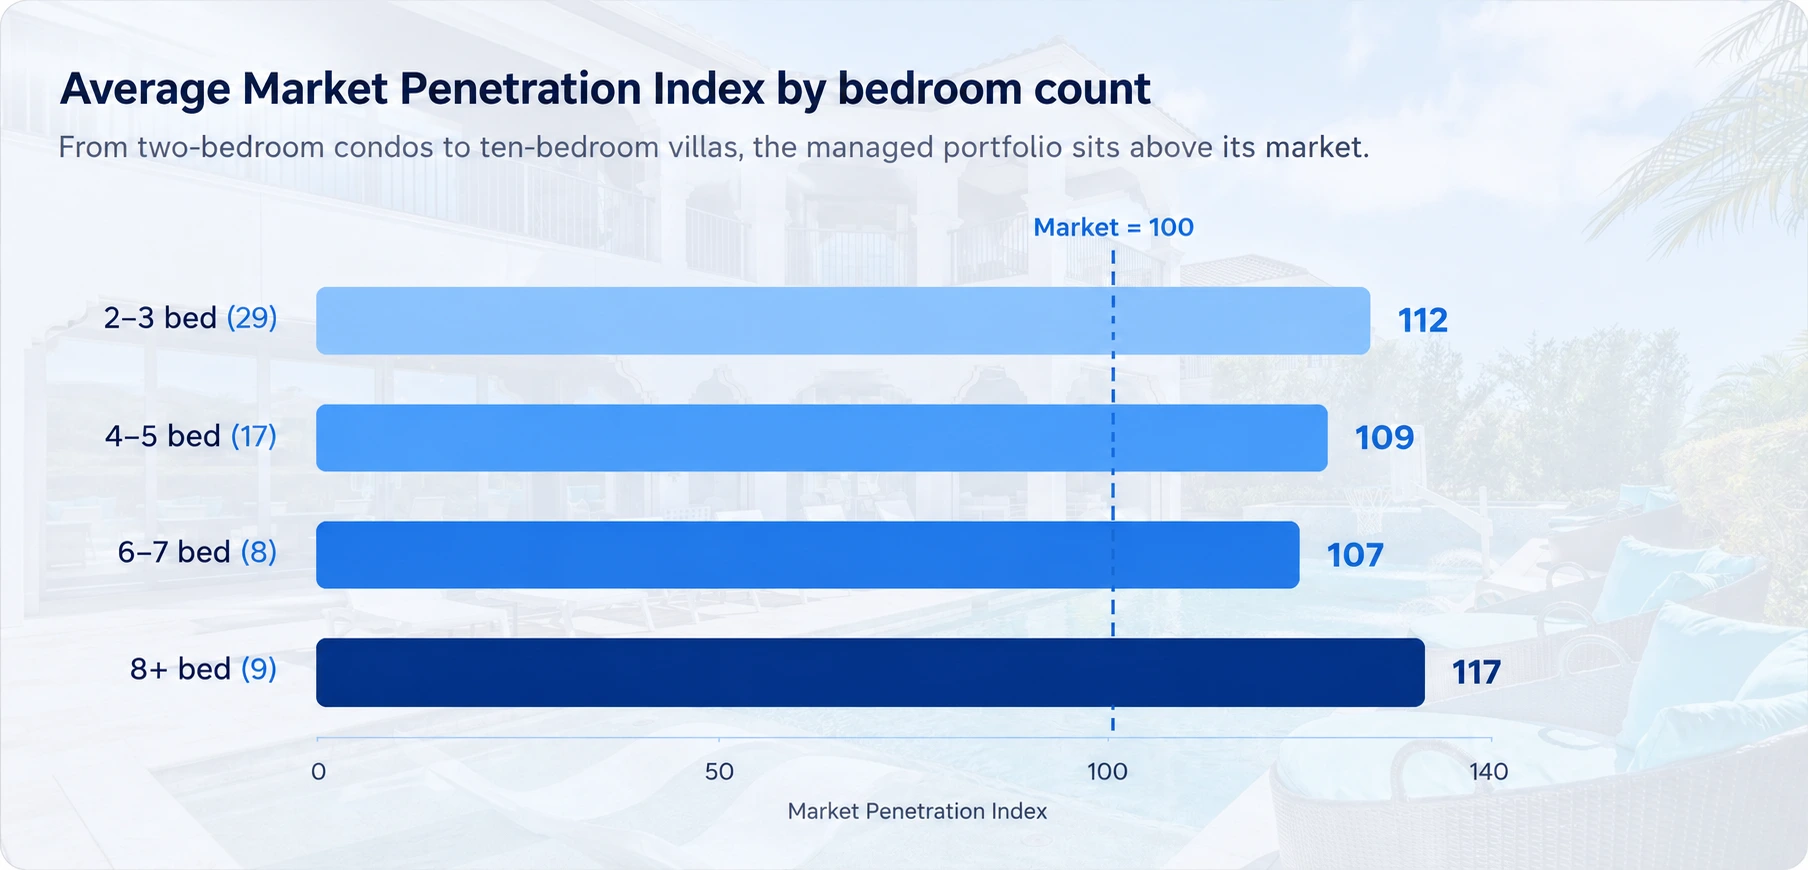
Large homes are the hardest to fill consistently. More bedrooms means higher nightly rates, a smaller pool of guests, and longer booking lead times. The fact that our 8+ bedroom properties sit at 117 MPI tells you something about how our dynamic pricing and rate optimization handles the toughest segment in the market.
The Twelve Homes Furthest Ahead of Their Market
These are real homes in our portfolio, measured against their own competitive sets over the last twelve months. Every number below comes directly from PriceLabs.
| HOME | MARKET | BEDS | OUR OCCUPANCY | COMP SET | MPI |
|---|---|---|---|---|---|
| 8020 Tuscany Way #6203 | Davenport | 2 | 59.2% | 31.0% | 191 |
| 2839 Bookmark | Kissimmee | 10 | 74.5% | 40.7% | 183 |
| 1116 Sunset View Circle #202 | Kissimmee | 3 | 78.8% | 46.6% | 169 |
| 1598 Heritage Crossing Ct | Kissimmee | 3 | 81.5% | 57.3% | 142 |
| 904 Charo Parkway #531 | Davenport | 3 | 75.4% | 55.0% | 137 |
| 110 Rogues Retreat | Davenport | 3 | 71.9% | 52.5% | 137 |
| 2813 Almaton Loop #305 | Kissimmee | 3 | 90.1% | 65.8% | 137 |
| 8804 Bengal | Kissimmee | 8 | 76.0% | 55.8% | 136 |
| 8493 Crystal Cove Loop | Kissimmee | 3 | 85.8% | 63.2% | 136 |
| 7735 Comrow (Windsor Hills) | Kissimmee | 4 | 90.1% | 66.5% | 135 |
| 2813 Almaton #105 | Kissimmee | 3 | 86.2% | 65.8% | 131 |
| 7660 Comrow #305 | Kissimmee | 3 | 86.3% | 66.6% | 130 |
Notice the range. A 2-bedroom Davenport condo nearly doubling its competitive set’s occupancy. A 10-bedroom Kissimmee villa running 74.5% against a 40.7% market. A Windsor Hills 4-bedroom at 90.1% occupancy. These aren’t cherry-picked months. These are full twelve-month track records.
What Drives the Difference in Orlando Airbnb Management
Filling more nights than the market doesn’t happen by accident. It’s the result of five things working together, every day, on every property. This is what separates Orlando vacation rental management that produces results from the companies that just collect a fee.
Revenue-first pricing, not set-and-forget
We use PriceLabs to adjust rates daily based on demand signals, local events, competitor pricing, and booking pace. A self-managed owner checking prices once a month misses the $320/night weekend that should have been $280 on Wednesday. We don’t miss it. That’s the difference between dynamic pricing for Orlando vacation rentals and guessing.
Listing optimization that ranks your property first
Airbnb’s search algorithm rewards specific behaviors: response time, review velocity, listing completeness, pricing consistency. Our Airbnb listing SEO and optimization attacks all of them. Higher search rank means more eyeballs, which means more bookings, which means more reviews. The cycle compounds.
Multi-platform distribution, not single-channel dependence
Relying on Airbnb alone leaves money on the table. We list across Airbnb, VRBO, Booking.com, Expedia, and Google Vacation Rentals. More channels means more visibility, which means more bookings. Our booking management system keeps calendars synced across all channels.
Guest experience that protects your reviews
A 4.81-star average across 100+ properties isn’t luck. It’s process. Pre-arrival communication, mid-stay check-ins, professional turnover cleaning, and maintenance response times that prevent bad reviews before they happen. Reviews are the currency of vacation rental management in Orlando. Protect them and occupancy follows.
Longer stays, fewer turnovers
Our average booking runs 7.2 nights against a 4.0-night market comparable. Fewer changeovers per occupied night means lower cleaning costs, less wear on your property, and fewer unsellable one-night gaps in the calendar. This is one of the biggest hidden advantages of professional Orlando Airbnb management. Longer stays happen when you stop self-managing and let the pricing engine optimize for total Orlando vacation rental revenue, not just nightly rate.
Performance Across Orlando’s Top Resort Communities
We manage homes in Kissimmee, Davenport, and Four Corners. The outperformance from our Orlando vacation rental management isn’t isolated to one neighborhood. It holds across communities with very different guest profiles, price points, and competitive dynamics.
Here’s where you can dig into the numbers for each resort we manage. Every guide includes rental income projections, expense breakdowns, HOA rules, and what professional Orlando Airbnb management actually produces at that specific community:
What Professional Short-Term Rental Management Orlando Owners Should Expect
Your calendar fills faster than your neighbors’
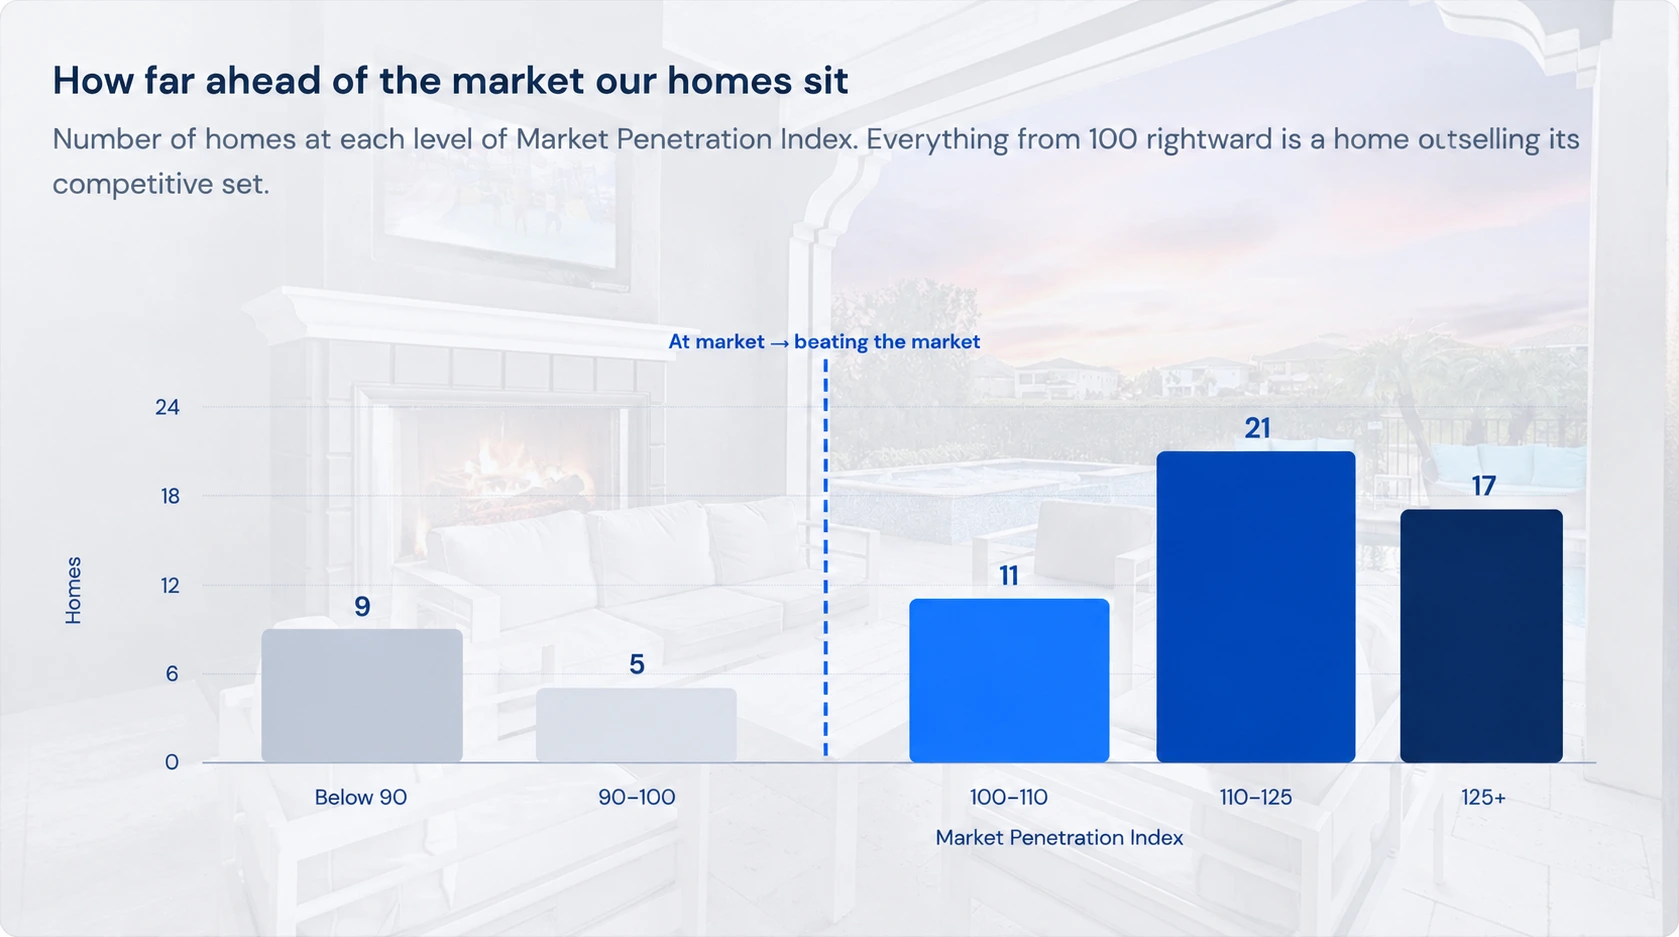
Not against a city average. Against the actual homes competing with yours on the same streets, matched on bedroom count. The median managed home sells 15% more nights than that set, and nearly four in five beat it outright. If you’re handling your own short-term rental management Orlando style and wondering why the house next door seems booked more often, this is probably why.
The advantage is consistent, not a good quarter
We were ahead of the market in every one of the last seven months for which comparable data exists. In both Kissimmee and Davenport. At every home size from two-bedroom condos to ten-bedroom villas. This is what consistent vacation rental management Orlando owners should expect from a company that tracks the data. Not a seasonal spike. Not a one-time win.
Longer stays mean lower costs
Our average booking runs 7.2 nights against a 4.0-night market comparable. Fewer changeovers per occupied night means lower cleaning costs, less wear on your furniture, and fewer unsellable one-night gaps in the calendar. If you want to maximize vacation rental income in Orlando, booking duration matters as much as nightly rate.
MIKE CHEN
Founder & Licensed Realtor, FunStay Florida
“I started as a vacation homeowner in Orlando. I know what it feels like to check your calendar and see empty nights you can’t explain. That’s why we built everything around measurable performance, not promises. When an owner asks ‘is this working?’, I want the answer to be a number, not a story. These PriceLabs results are what happen when every piece of the system, from pricing to guest experience to listing SEO, works together across 142 listings.”
More from FunStay Florida
If you’re researching Orlando Airbnb management or trying to figure out how to maximize vacation rental income in Orlando, these are worth reading:
- How Airbnb property management impacts STR profitability
- Can an Airbnb in Orlando pay for itself in 2026?
- Local vs national vacation rental management in Orlando
- How Airbnb management services boost vacation rental income
- Airbnb Superhost requirements in 2026
- Orlando Airbnb noise complaints: how to prevent party bookings
- Florida’s short-term rental laws
How These Numbers Are Calculated
The benchmark. PriceLabs builds a competitive set for each individual listing from nearby short-term rentals with the same bedroom count, typically several hundred properties. A 3-bedroom Windsor Hills condo in this portfolio is measured against 343 nearby 3-bedroom listings. Comparisons on this page are against those per-home comp sets, never a blended city average.
Market Penetration Index (MPI) = our occupancy / competitive-set occupancy x 100. It is the standard fill-performance measure used in hotel revenue management. 100 means performing exactly in line with comparable properties.
The cohort. Home-level figures cover the 63 managed homes that traded for the full twelve months to 31 July 2026, so ramp-up periods on newly onboarded homes don’t distort the comparison. The portfolio contains 142 listings in total. Month-by-month occupancy uses all revenue-generating homes in each month (65 to 90 depending on the month).
Length of stay. The 7.2-night portfolio average is measured across all bookings in the twelve months to 18 August 2026. The 4.0-night market comparable is the length-of-stay figure PriceLabs publishes for a representative comp set in the portfolio’s largest segment (3-bedroom, Windsor Hills / Kissimmee, 343 listings). PriceLabs does not publish a single blended market length-of-stay across all segments.
Revenue and RevPAR. Rental revenue is gross rental income net of discounts, recognised prorated across stay dates. RevPAR is revenue per available night. The 2026 on-the-books comparison measures bookings held today for 2026 stays against bookings held on the same date last year for 2025 stays.
Data pulled from PriceLabs on 19 August 2026. Reservation data last synced from the property management system within 24 hours of that pull.
Ready to See What Professional Management Can Do for Your Property?
Looking for the best Airbnb management company Orlando owners trust with verified data? Get a free rental projection for your Orlando, Kissimmee, or Davenport vacation rental.